Heart rate zones are the foundation of how Zenith measures aerobic strain. Every second of heart rate data your watch collects gets mapped to a zone, and each zone contributes differently to your daily strain score. Higher zones contribute disproportionately more.
Why Heart Rate Reserve, Not Max HR Percentage
Most fitness platforms define zones as simple percentages of max heart rate. Zone 2 might be 60-70% of max. That approach is easy to calculate but ignores a critical variable: your resting heart rate.
Two people with the same max heart rate of 190 bpm but different resting heart rates have very different cardiovascular capacities. The person with a resting heart rate of 50 has a heart rate reserve of 140 bpm. The person at 75 has a reserve of 115. Flat percentage-of-max zones would place them in the same zone at the same heart rate, even though they’re working at meaningfully different intensities.
Zenith uses 6 heart rate zones calculated using the heart rate reserve method. Developed by Karvonen et al. (1957), this method personalizes zones based on both your resting heart rate and maximum heart rate, making them more accurate than simple percentage-of-max formulas. The formula is straightforward:
Target HR = Resting HR + (% intensity × Heart Rate Reserve)
This means your zones are built on the range your heart actually operates in, not just a fraction of its ceiling. As your fitness improves and your resting heart rate drops, your zones automatically adjust to reflect your new baseline.
Your Six Zones
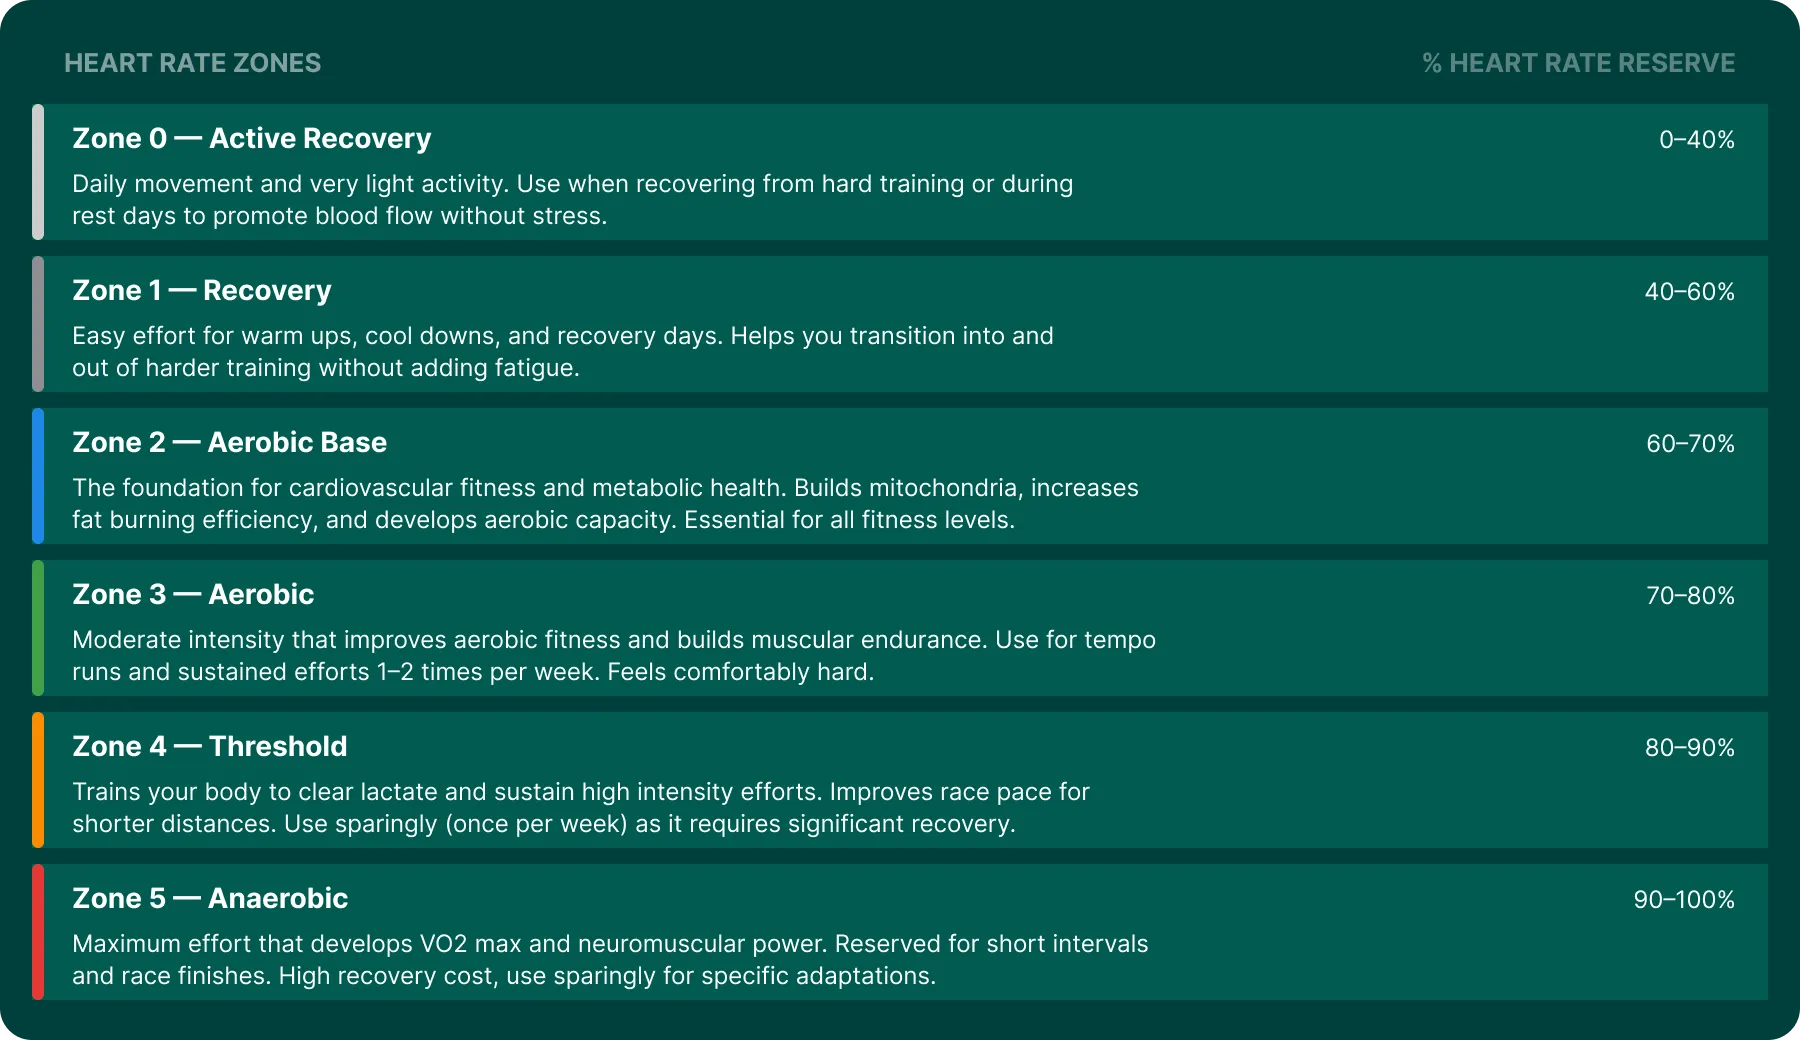
Zenith divides heart rate into six zones based on percentage of heart rate reserve.
How Your Zones Are Set
Zenith needs two numbers to calculate your zones: max heart rate and resting heart rate.
Your zones are personalized using data from your connected device. When you first sync, Zenith scans your activity history for any all-out efforts and sets your max heart rate to the highest value found. If no observed max exists, Zenith estimates it using the NTNU formula (211 - 0.64 × age) from Nes et al. (2013), which is more accurate across age groups than the traditional 220 - age. You can also adjust it manually at any time.
Resting heart rate is calculated from your wearable’s overnight data using a smoothed 30-day average. The smoothing is asymmetric: drops from fitness gains are weighted more heavily than spikes from illness or bad nights. This keeps your zones stable day to day while still reflecting real improvements over time.
As your fitness changes, both inputs shift, and your zones adjust automatically.
How Zones Feed Into Strain
Your daily strain score is built from time spent in each zone during activities and throughout the day. The relationship between zones and strain is deliberately non-linear. Time in zone 5 contributes far more strain per minute than time in zone 1. This reflects the exponential relationship between heart rate intensity and physiological cost, based on Banister’s TRIMP (Training Impulse) model.
In practice, this means 20 minutes at high intensity creates more aerobic strain than 30 minutes at low intensity. A short, hard interval session and a long easy run can produce similar strain scores, which is the point. Your body doesn’t care how long you were out there. It cares how hard the work was.
Heart rate data collected outside of activities also counts. If your heart rate is elevated throughout the day from stress, poor sleep, or general activity, that contributes to your background strain. Zenith accounts for this so your daily score reflects total cardiovascular load, not just what happened during a workout.
Using Zones to Hit Your Strain Target
Your recovery score generates a recommended strain range for the day. Zones are how you control where you land in that range.
Low strain target (recovery day). Stay in zones 0-1. Easy walks, light stretching, casual movement. If you have a workout planned, keep the intensity low and the duration short.
Moderate strain target. Build most of your session in zone 2 with brief pushes into zone 3. This is the bread and butter of aerobic development. A 45-minute easy run or a steady bike ride lands here.
High strain target. You need time in zones 4-5. Intervals, tempo efforts, or race-pace work. These sessions are where fitness is built, but they carry a real recovery cost. Zenith’s strain target accounts for this.
The strain target isn’t a prescription for what workout to do. It’s intensity guidance for whatever you already have planned. If your plan says “8-mile run” and your strain target is low, take it easy. If the target is high and you’re feeling good, push the pace.
Training Across All Zones
A common mistake is spending too much time in the middle. Zone 3 feels productive because it’s hard enough to notice but not hard enough to hurt. But most endurance coaches advocate a polarized approach: the majority of training in zones 1-2, with targeted sessions in zones 4-5, and relatively little time in zone 3.
Zenith’s time-in-zone breakdown after each workout shows you exactly where you spent your effort. Over weeks, patterns emerge. If you’re consistently in zone 3 when you should be in zone 2, you’re accumulating fatigue without the aerobic benefit of easy work or the performance benefit of hard work.
Training across all zones builds a well rounded athlete and improves overall performance. The zones exist so you can be intentional about which system you’re training on any given day.
Tracking It
Your Garmin collects the heart rate data. Zenith maps every second to a zone, calculates the strain contribution, and folds it into your daily score. After each activity, you can see time spent in each zone. Over time, Zenith’s trends show how your zone distribution is shifting.
Want to see your heart rate zones in action? Try Zenith. It’s free to start.