Most wearables give you a calorie count or a duration, but neither tells you how hard the session actually was. A 60-minute easy jog and a 60-minute tempo run are not the same workout.
Strain is Zenith’s answer: a single score from 0-100% that represents how much total stress your body absorbed today.
Strain Is Non-Linear
Strain runs from 0-100%. The scale is deliberately non-linear. Most of your training days land between 20% and 70%. Hitting 85%+ requires serious effort. Hitting 100% is nearly impossible in a single day.
Zenith breaks the scale into six zones:
| Zone | Range | Description |
|---|---|---|
| Minimal | 0-40% | Very light activity, daily movement |
| Light | 40-55% | Easy effort, warm-ups and recovery |
| Moderate | 55-70% | Steady effort, building aerobic base |
| Hard | 70-85% | Challenging effort, improving fitness |
| Very Hard | 85-95% | High intensity, significant strain |
| All Out | 95-100% | Maximum effort, rarely achieved |
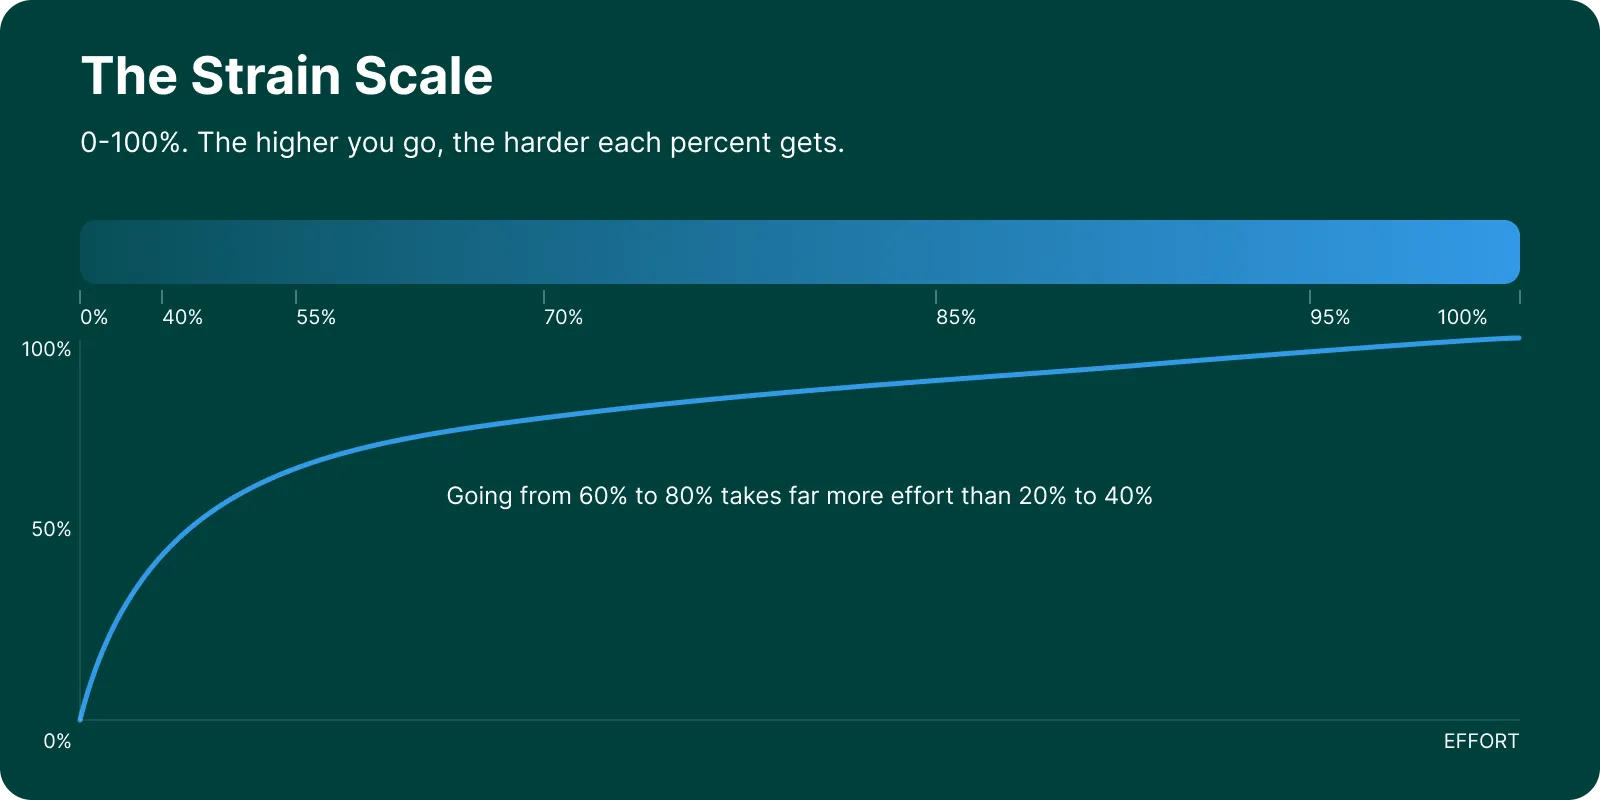
The non-linearity matters. Going from 60% to 80% requires significantly more effort than going from 20% to 40%. The scale compresses at the top because your body’s physiological response to intensity isn’t linear either. Each additional percent of strain requires more effort than the one before it.
Aerobic and Muscular
Zenith tracks two distinct types of strain and combines them.
Aerobic strain comes from your heart rate data during cardio activities: running, cycling, swimming, hiking, and anything else that elevates your heart rate. Time spent in higher heart rate zones contributes disproportionately more than time in lower zones. 20 minutes at threshold pace generates more aerobic strain than 30 minutes of easy jogging. The weighting is based on Banister’s Training Impulse, a well-established model from exercise science that accounts for the non-linear relationship between heart rate intensity and physiological load.
Muscular strain comes from strength training. Instead of heart rate zones, it uses intensity zones based on how heavy the weight is relative to your max (covered in depth in How Zenith Tracks Strength Training). An all-out set near your max generates dramatically more muscular strain than a light warmup set, even if your heart rate barely changes.
The distinction matters because a hard lifting session and a hard run stress your body in different ways. Heart rate alone doesn’t capture the fatigue from heavy strength work. Zenith measures each type of strain separately, then combines them into a single score.
One Day, One Score
If you run in the morning and lift in the evening, you don’t get two separate strain scores. Zenith combines all your activities into a single daily strain. The combination follows a key principle: your hardest activity dominates. Adding a second workout doesn’t double your strain. It increases it, but with diminishing returns.
Here’s what that looks like with real numbers:
- Morning run: 52%
- Afternoon bike: 43%
- Evening weights: 65%
- Daily total: 78% (not 160%)
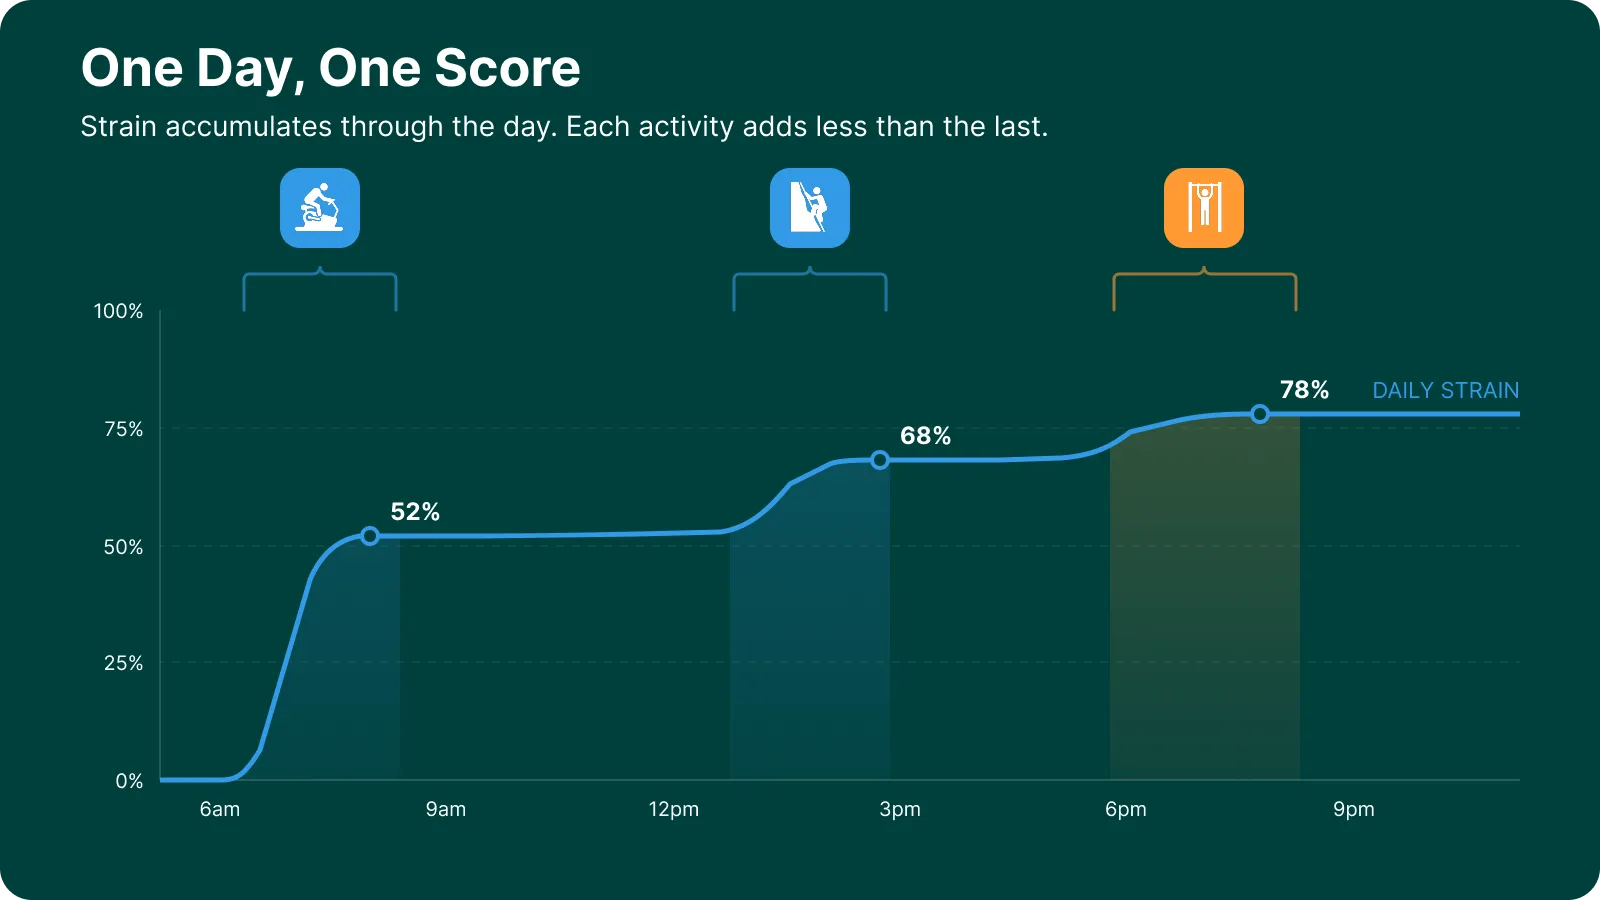
Your daily strain will always be at least as high as your hardest single activity. Additional activities push the total higher, but progressively less as it climbs. This reflects how your body actually works. The second hard session of the day is stressful, but not as novel a stressor as the first.
Zenith also factors in heart rate data from outside of activities. A stressful day at work with an elevated heart rate contributes to your daily strain even if you don’t work out.
The Week Matters More Than the Day
A single day’s strain is useful, but training adaptations happen across weeks, not days. Zenith’s weekly strain uses a weighted average that gives more credit to harder days.
| Week | Pattern | Simple Average | Weighted Average |
|---|---|---|---|
| A | One day at 95%, six days at 38% | 46% | 58% |
| B | Seven days at 50% | 50% | 50% |
Week A’s weighted average is higher because one high-strain day creates more accumulated fatigue than seven moderate ones. The weekly view is often more informative than any single day.
How Hard Should Today Be?
Strain tells you what happened. Zenith also uses it to guide what comes next.
Based on your current recovery score, Zenith calculates a recommended strain range for the day. It shows up as an arc around the strain ring on your home screen. When recovery is high, the target range widens and shifts upward. When recovery is low, it tightens and drops.
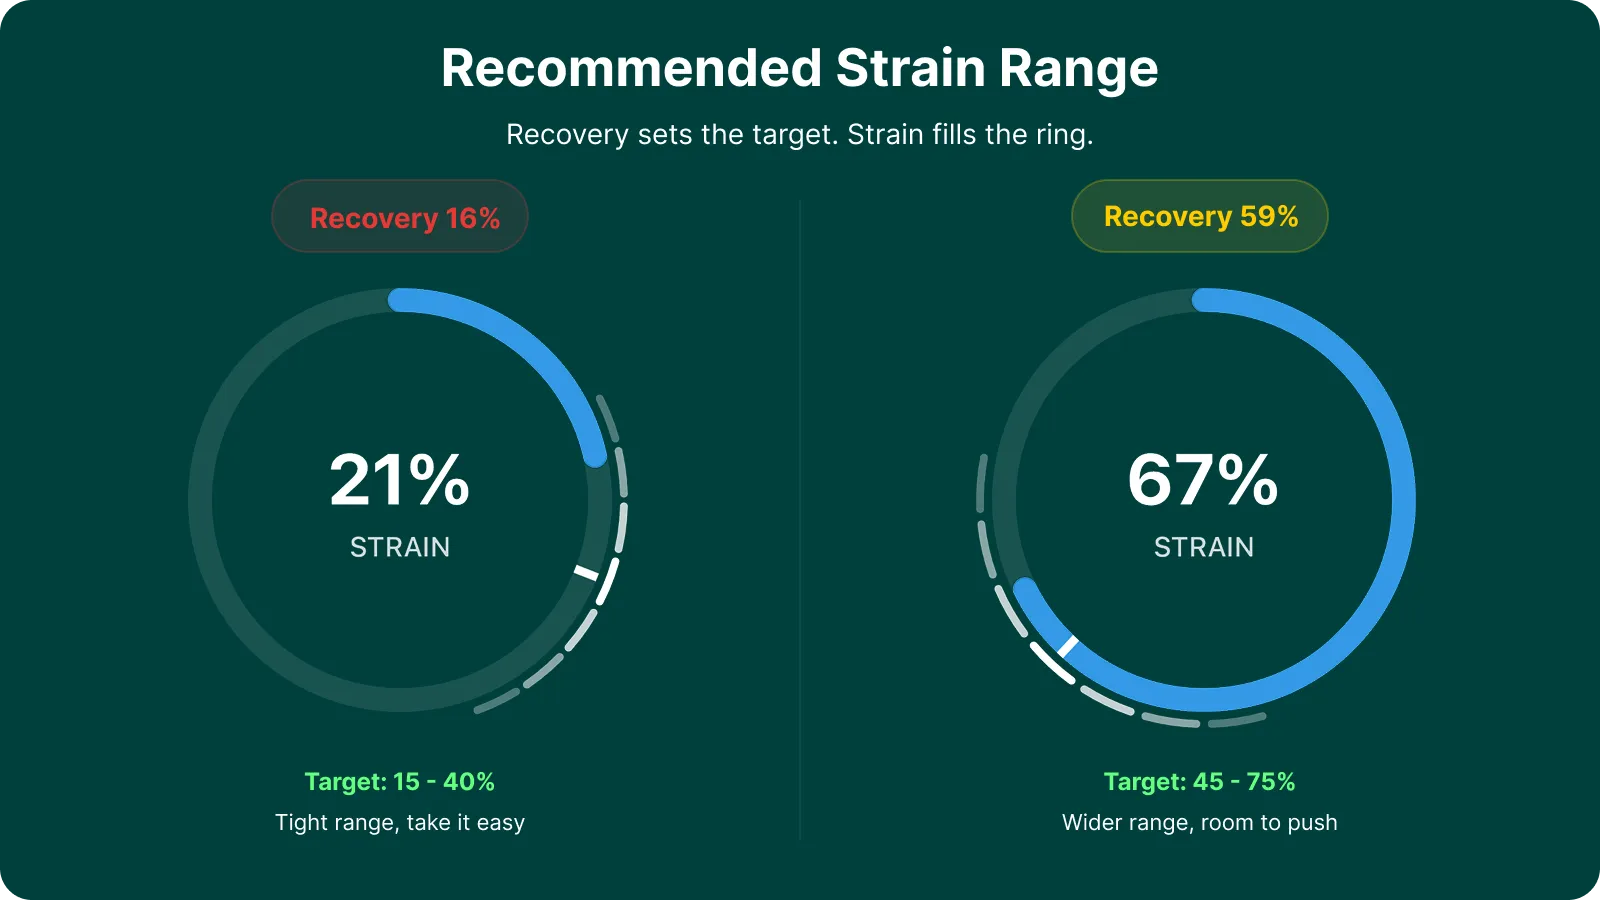
Most athletes already have a training plan. Zenith doesn’t replace it. If you have a long run on the schedule, the recommended range tells you whether to push the pace or back off. If you’re planning a rest day, it confirms that’s the right call.
Strain feeds into recovery, and recovery determines your recommended strain for tomorrow. Over time, the feedback loop means less guessing about whether to push or back off.
Your Watch Already Measures It
If you wear a Garmin, you’re already collecting the data. Zenith turns your heart rate into a single score that reflects how hard your day actually was, and folds your lifting into the same system.
Want to see your strain score? Try Zenith. It’s free to start.